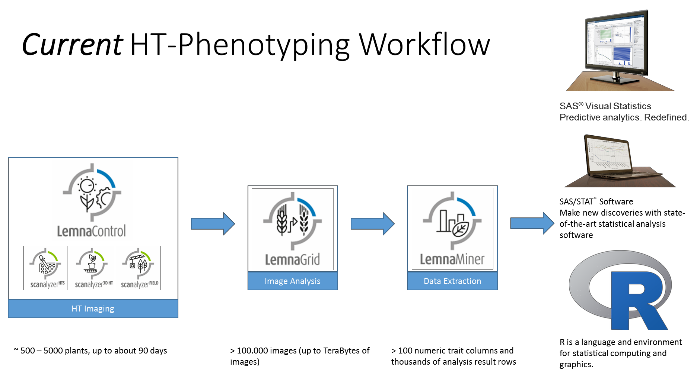
The LemnaTec software package is divided into different parts: LemnaLauncher serves as the entry point to quickly evaluate measurements; LemnaControl software performs experimental imaging settings and instrument control; LemnaBase provides database infrastructure for storing and accessing images; LemnaGrid is a comprehensive image analysisToolbox; LemnaMiner performs basic data analysis and has comprehensive export capabilities in all standard formats.
All of LemnaTec's software is constantly improving to meet the growing demand for smart image and data analysis
1.l em's launcher
LemnaLauncher is the main framework that allows access to all LemnaTec software products across the entire product range.All research images, analysis results and metadata are accessible in LemnaLauncher and are directly associated with the researcher's product configuration and image analysis configuration settings.This provides complete data management and ultimately quality assurance.The integration of all software modules ultimately provides researchers with a complete digital phenotypic workflow - from data acquisition, image analysis to LemnaMiner statistical results display.In addition, continuous working processes can accelerate the generation and analysis of results without human interference and ensure data integrity to the greatest extent.
For all tasks from starting the experiment, to controlling the experiment run to final analysis, LemnaLauncher provides an initial interface for these tasks, while providing researchers with additional functions and options.
During the experiment, the featured data monitoring viewer enables researchers to continuously update the experimental design.Using the Overview Tile Viewer, users can access the acquired images and attached metadata, for example.Image analysis results are provided by LemnaGrid, with additional information such as location, PAR, RH and attached to Scanalyzerfieldother weather data.

picture1:l em's launcherTree View
To monitor all experimental data, LemnaLauncher introduces the snapshot concept, organizing all images and analysis results into a convenient overview format—defined by ID tags representing the experiment and the time to obtain the snapshot.After passing common measurement marks, snapshots are grouped and used for group assays for the same experiment.
To get a comprehensive understanding of snapshot information, researchers can select a test image and compare it with all available images, splitting the view into multiple displays to give the researcher a faster and more detailed impression.For example, the growth rate measurement and analysis of plants in the control and treatment groups.Colleagues, researchers have the opportunity to view all available image patterns simultaneously to detect early sign experimental conditions and to detect the slightest differences between the processing and control groups.
After the experiment is completed, the data are ready for analysis, and after a quick view of the images, the researchers can directly access the statistical toolbox LemnaMiner without leaving the LemnaLauncher.
feature:
- Creation and management of system users
- Provide the home screen and grant access to the LemnaTec software module:
•LemnaBase, database management
•LemnaControl controls connected hardware (link to Control and hardware)
• LemnaGrid Image Analysis Toolbox
•LemnaMiner displays and filters statistical related data for experiments
- Tree view, comprehensive understanding of all acquired images and attached metadata such as image analysis, weight, watering volume
• Options for filtering displayed items, which will help you track data, even thousands of images stored in the database
- Filter by snapshot, for example, display all information about a specific feature or a single plot
- Show only images and results of specific experiments or researchers
- Show only snapshots in a specific time frame
•Sorting options make searches more efficient.
- By time
- Snapshot ID
- Experiment
- Researcher
- etc
• View patterns, quickly view and manually investigate your phenotypic data.
- Single view, detailed inspection
•View the acquired single image (RGB, fluorescence, etc.) (link to the camera)
• Image analysis results
•Attached metadata
- Multiple views, all information is clear at a glance or compare different results, up to 16 images at a time
•View all acquired images of a single image at once, so that internal correlations or differences can be easily checked
- Data monitor, tracking your hardware
• Overview of all current and planned tasks
- Analyze jobs, analyzed images and what the server still needs to analyze
- Maintenance, which will help you arrange all necessary maintenance work in your hardware
- Notify in advance, edit and view planned imaging schemes for each plant.For example.VIS imaging is performed in your control group, while imaging is performed in the processing group using all available cameras.
- System jobs outline scheduled tasks such as watering and imaging jobs.
2.l em control
 |
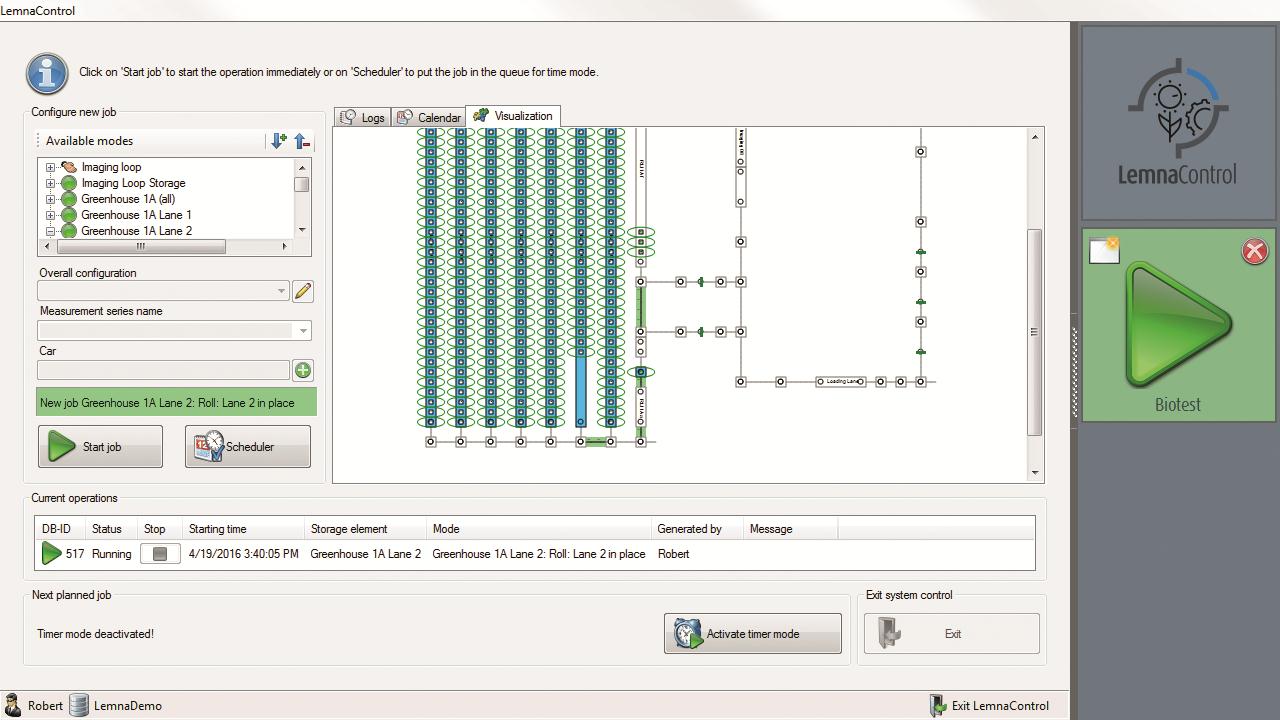
LemnaTec takes into account the software needs of customers during the development and improvement process.Before each test, the customer will be taught how to identify the location of the nursery. The customer can use manual operations. Industrial devices are used to use Field Scanalyzer.fieldThe precise setting of the X and Y axis directions of the system can ensure that all pictures can be collected correctly, even if there are differences during sowing.In the control software interface, customers can arrange imaging work according to the trial plan.Imaging work includes camera selection, imaging area, height selection and imaging time, etc.
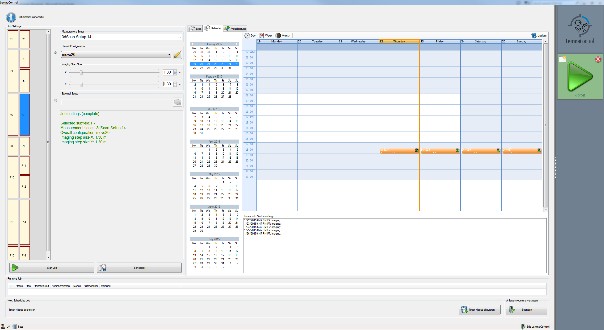
picture2:l em control:The field layout can be seen on the left, the middle part allows users to choose different imaging modes, and the work plan is displayed on the right.
As shown in the figure below, the length of time including the job will appear in the work calendar.Over time, the system will create a statistic for each repeated execution of the job, allowing users to accurately predict the length of each job.The Schedule feature also allows the set time window to select start and end for each job.
picture3:l em co TR OLThe pilot plan in
3.l em grid
 |
The system utilizes a graphical programming language (similar to Labview or Microsoft's Robotics Studio), which can establish connections of different algorithms to form intuitive graphicalization of image processing.Creates an image processing flow line that extracts the required properties from the original image.To achieve high-throughput image processing, an image processing program (Grid) can be established first and this Grid can be applied to all image processing.
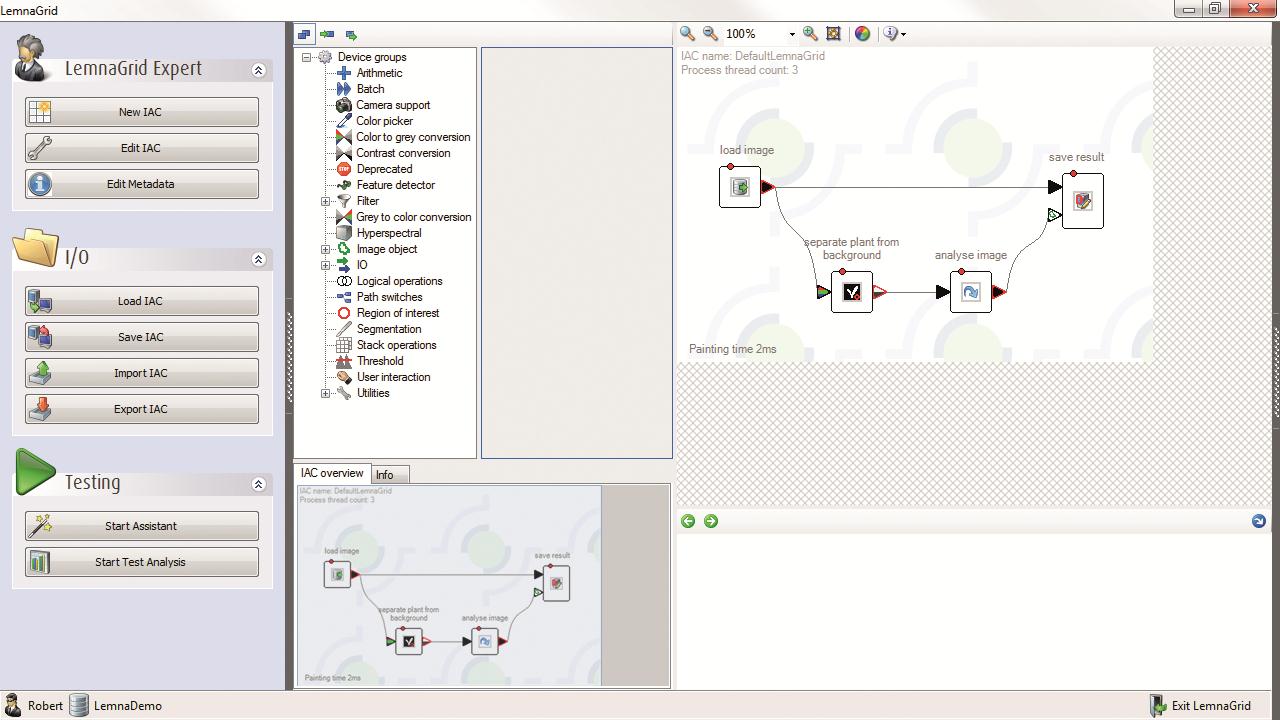
picture4:l em gridSoftware interface
A subset of available implementation and testing equipment:
·Different color spaces: RGB, HIS, LAB and LUV;
·Edge filter (detects the edges of pictures, such as those of plants);
·Morphological operations;
·segmentation;
·Threshold;
·Not deformed;
·Classification;
A fully developed algorithm provided by LemnaTec, the Lausanne Institute will integrate the possibilities of any customized developed image analysis tool using plug-in devices.This plug-in device can be used with any .exe file (or created with Matlab).This will ensure that the strength of the LemnaTec algorithms that can be obtained in other fields are combined for existing programs for image analysis.
4.DATA base – l em base
 |
LemnaBase serves as a central database to provide interfaces for all LemnaTec's software modules. According to the experimental throughput and the complexity of the LemnaTec system, LemnaBase requires a dedicated server or local workstation.That is to say, the LemnaTec database manages pictures in FTP through the server, and manages metadata of other experiments and different experiments through SQL.To quickly process large batches of data, LemnaBase provides specific management functions such as:
·Subdividing experimental data from different experiments or working groups
·The database can be replicated or shared images or results
·Data protection function to avoid overwrite
·Setting restrict access to certain data
·Set different permissions for users of different levels
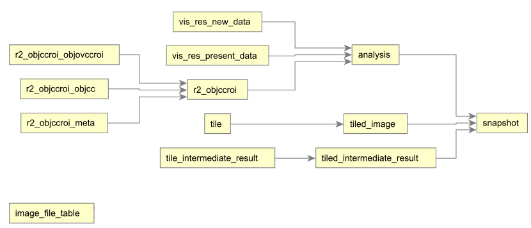
picture5: A brief overview of database layout
5.data mining – l em miner
|

LemnaMiner extracts data from the LemnaTec database and analyzes it, converts the image analysis data and other experimental data results into biological related information, and conducts subsequent statistical analysis.The Data Management Toolbar provides the LemnaMiner software protocol.
Standard query: sample labeling or testing system or user, etc.; control data for the entire experimental process; all results of one experiment; all results of one user.
Based on the SQL protocol, reanalyze the image data:
·Customizable new analysis parameters
·Manual correction and remarks, all operational processes will be automatically recorded
·Can identify minor changes in color
·Automatically selectable
·Customizable standards
·Traits can be evaluated by relative or absolute values
6.l em-R
Easy access to all data and drawing functions
Seamless integration with R statistics
Configurable data processing capabilities
Visual data and pictures
Report Generator

